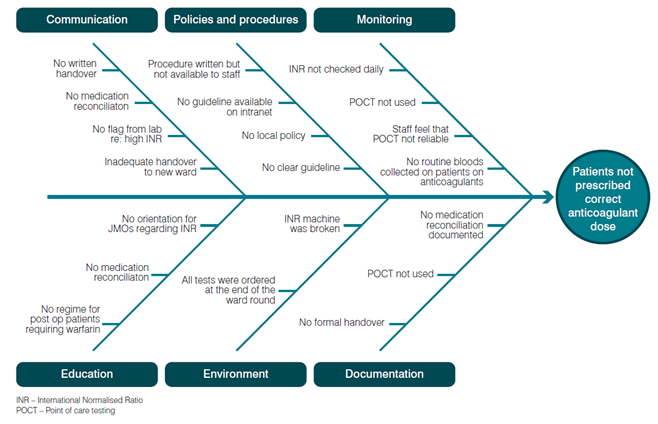
Cause and Effect Diagram
A Cause and Effect Diagram (also called a Fish bone Diagram or Ishikawa Diagram) is used to provide a pictorial display of a list in which you identify and organise possible causes of problems, or factors needed to ensure success of some effort. It is an effective tool that allows people to easily see the relationship between factors to study, processes, situations, and for planning.
The Cause and Effect Diagram aims to show all the causes leading to some head event. The issues in a Cause and Effect Diagram are often derived from a brainstorming session followed by the development of an Affinity Diagram.
The primary branch represents the effect (the quality characteristic that is intended to be improved and controlled) and is labelled on the right side of the diagram. Each major branch of the diagram corresponds to a major cause (or class of causes) that directly relates to the effect. Minor branches correspond to more detailed causal factors.
This type of diagram is useful in any analysis, as it illustrates the relationship between cause and effect in a rational manner.
Start your own Cause and Effect Diagram by downloading this template in PowerPoint and keying in your information.
- Cause and Effect Diagram Template PPT ~83KB
Figure 1: Example of a Cause and Effect Diagram
Reasons why patients are not on a standardised anticoagulation pathway

To learn more about Cause and Effect Diagrams please refer to the Institute for Healthcare Improvement website.
Institute for Healthcare Improvement (IHI) video links
- Cause and Effect Diagrams ~5 mins
Feedback
Was this quality tool web page useful? Do you have suggestions on how we might make it even better?
Please provide us with your feedback via this short evaluation survey.
