Quality Improvement Tools
Three Quality improvement tools for SAP have been created to assist in launching a successful Quality Improvement project and manage performance improvement. These can be adapted to your local facility and specific aims.
You can use our Quality Improvement Data System (QIDS) to plan, track and progress your surgical antibiotic prophylaxis quality improvement project. For more information, please email CEC-AMS@health.nsw.gov.au
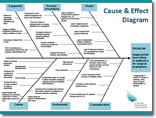
Cause & Effect Diagram
The Cause & Effect Diagram helps teams to explore and display the many causes contributing to a certain effect and their relationship to each other, in order to see factors, processes and situations to study and to plan for successful solutions.
Download PDF ~248KB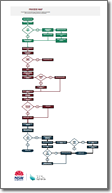
Process Map/Flow Chart
The Process Map or Flow Chart is a visual representation of the sequence of steps in a process. Understanding the process as it currently operates is an important step in developing ideas about how to improve it. This makes Process Maps especially useful in the early phases of improvement work.
Download PDF ~275KB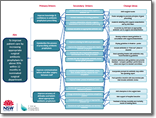
Driver Diagram
A Driver Diagram is a simple tool that helps teams to plan and structure an improvement project. It shows the relationship between the overall aim of the project, the primary drivers that contribute directly to achieving the aim, the secondary drivers that are components of the primary drivers, and specific change ideas to test for each secondary driver.
Download PDF ~372KBFor an editable copy of these tools, please email your request to CEC-AMS@health.nsw.gov.au.
For more information on Quality Improvement Tools available, please visit the CEC Academy.