Flow Charts
A Flow Chart provides a systematic, visual display of the components of a process. It is a road map of where things are happening, the order in which things happen and the relationships between parts of a process. A Flow Chart is recommended as the first step in almost any study. Often a Flow Chart may reveal that a process does not operate the way management or the operators in the process actually think it does.
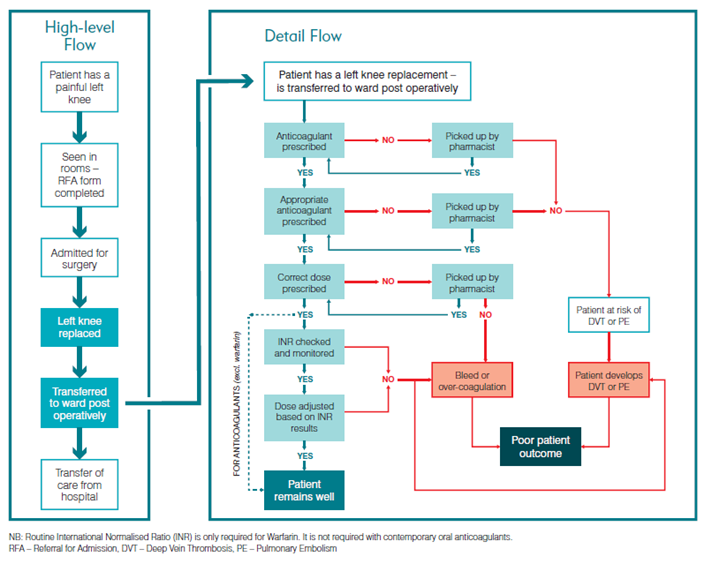
The first step in developing a Flow Chart is a high level flow, which provides a helicopter view. The second step is a more detailed Flow Chart of all the steps that the patient may take on their journey. One way to do this is for the team to write down the current process on a whiteboard. In the example below (see Figure 1), this will involve following a patient on anticoagulants from when they first see a surgeon, admission for surgery and post-operative care.
Start your own Flow Chart by downloading this template in PowerPoint and keying in your information.
- Flow Chart Template PPT ~84KB
Figure 1: Flow Chart of Patient Journey

Environmental considerations

Teams may also identify what resources are used in each step of the process to understand the environmental impact. This may help uncover opportunities to improve environmental impacts and/or potential unintended consequences to the environment. For more information about environmental impacts in processes and quality improvement please refer to the Clinical Excellence Commission’s Environmental sustainability in quality improvement resources.
To learn more about Flow Charts please refer to the Institute for Healthcare Improvement website. You may need to take a moment and register with the IHI for more in-depth information.
Feedback
Was this quality tool web page useful? Do you have suggestions on how we might make it even better?
Please provide us with your feedback via this short evaluation survey.
