Basic Statistics
Mean or Average
The mean is a measure of central tendency and is best described as the average value of a set of observations (figures). To calculate the mean you add up all the figures and divide by the number of observations (see formula and example below). The average is a form of continuous data and is graph using a run chart.
Assumption: The mean is used when you have no outliers (extreme values) ie: you have a normal distribution. A normal distribution can be determined by graphing the observations (figures) using a histogram with a normal curve. If the histogram / normal curve is symmetrical, then you can assume the data is normal and you can use the mean to determine the central figure (average).
The formula for calculating the mean is:
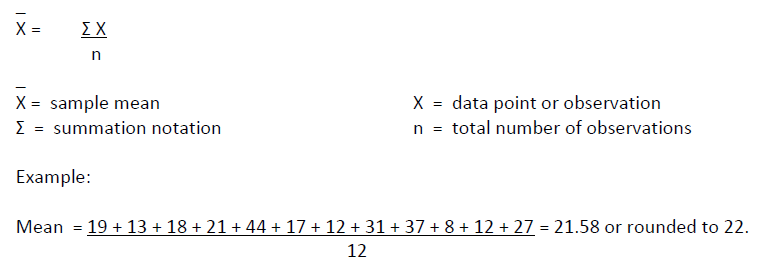
You can also use Excel, SPSS, Minitab or other statistical programs to automatically calculate the mean (average).
Median
The median of a set of observations is a number such that half the measurements fall below and median and half fall above. The median is of most value in describing large data sets and ones that do not have a normal distribution (non-parametric). The median is useful when you have outliers in your data set. It is often used when trying to determine the approximate value of houses in a suburb or the typical wage rate in an organisation. The median is a form of continuous data.
The median is calculated by sorting all the figures from lowest to highest. The Median is the figure in the middle. If you have an even number of observations then average the two middle figures.
Example:
8 12 12 13 17 18 19 21 27 31 37 44 = median is 18.5
You can also use Excel, SPSS, Minitab or other statistical programs to automatically calculate the median.
Mode
The mode is the measurement that occurs most frequently in a set of observations. The mode shows where the observations tend to concentrate.
Consider the following array of observations (see below). The mode is observation 12 as it occurs most frequently.
8 12 12 13 17 18 19 21 27 31 37 44 = mode is 12
You can also use Excel, SPSS, Minitab or other statistical programs to automatically calculate the mode.
Range
The range is a measure of dispersion. It is calculated by taking the difference between the largest and smallest observations (figures).
Range = largest observation – smallest observation
Consider the following array of observations (see below). The mode is observation 12 as it occurs most frequently.
8 12 12 13 17 18 19 21 27 31 37 44 = The range is 44 - 8 = 36
You can also use Excel, SPSS, Minitab or other statistical programs to automatically calculate the range.
You can also use Excel, SPSS, Minitab or other statistical programs to automatically calculate the mean (average).
Standard Deviation
The standard deviation measures the spread of the data about the mean value. It measures the spread of a distribution by using the mean of a data set as a reference point and then calculates how much each data value deviates from the mean.
The standard deviation is the square root of the variance.
The formula for calculating the standard deviation is:
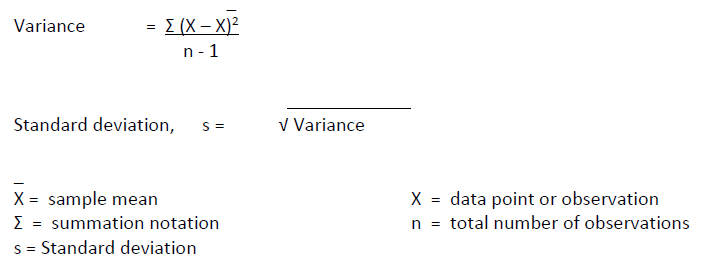
A rough estimate of the standard deviations is the Range/4(see Range). You can also use Excel, SPSS, Minitab or other statistical programs to automatically calculate the standard deviation.
Feedback
Was this quality tool web page useful? Do you have suggestions on how we might make it even better?
Please provide us with your feedback via this short evaluation survey.