Data for improvement
When testing your change ideas with PDSA cycles, you need to start collecting data to be able to determine if the changes made has resulted in an improvement. This data will be collected in 'real time' rather than retrospectively. It is likely most of this data will be quantitative but qualitative data can be equally informative.
What is a Family of Measures?
One measure alone is insufficient to determine if improvement has occurred. You are advised to include one or two measures from each of the following three categories.
It is important to define the numerator and denominator and provide an operational definition for each measure to ensure data consistency. (See example on outcome measures)
Outcome measures are closely aligned with your aim statement or the overall impact you are trying to achieve. They relate to how the overall process or system is performing, the end result.
- Example:
- number of patients assessed as at risk of dying within the index admission
- patients dying in preferred place of death
- number of patients identified as approaching end of life with documentary evidence that the patient was assessed, and a management plan was in put in place that reflected patient / family / carer wishes with end of life plans.
Process measures are the parts or steps in the process performing as planned. They are logically linked to achieve the intended outcome or aim.
- Example:
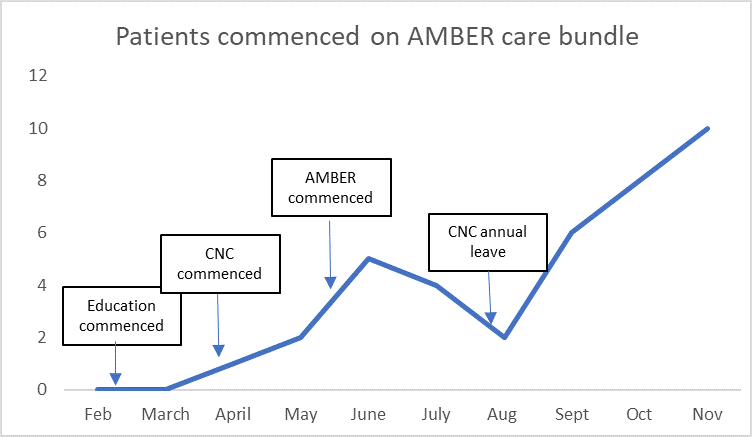
- Patients commenced on AMBER care bundle
- All AMBER patients have a resuscitation plan documented
- All AMBER patients have daily review and plan review.
Resources
Balancing measures look at the system from different directions or dimensions. They determine whether changes designed to improve one part of the system are causing new problems in another part of the system.
- Example:
- patients become upset around having the conversations
- patient / family complaints increase
The outcome, process and balancing measures provided are examples and can be adapted to your context.
What to consider before collecting data?
Think critically about the data you collect such how much, where to record and who can assist.
Before commencing PDSA cycles, you should:
- Review any baseline or historical data on performance of the process to be improved.
- Agree upon what should be measured – this includes the who, when, where and how the data will be collected for each measure
- Determine the most efficient way to access and collect the data
- Consider how useful the data will be and how you will present it (don't collect unnecessary data that won't be used)
- Decide where to record data and how it will be accessed by the team (for example, spreadsheet, QIDS - preferred)
- Consider assigning responsibility to individual team members for data collection for each measure
- Make sure to speak with staff and patients to hear about their experiences whilst you are testing
- You will still need to continue collecting data after the project to check that the improvements are sustained.
The key to data collection is not quantity. Rather than collecting a big sample size, you want to make sure the data is project specific and collected continuously so it is meaningful to present.
You need to make sure to collect enough data to be able to understand if the changes you are making are resulting in an improvement – too little data and you won’t be able to see improvement and too much is an over-investment of time and resources. As a minimum it is recommended you collect between five to ten data points each week (for example, collect data on five to ten patients).
This will vary depending on the size of your health service and the frequency of the problem. Regardless, it is recommended that the data you collect is either consecutive (for example, the first five patients) or random. Speak to your local quality improvement advisor about how much data to collect.
How do you make sense of and present your data?
Once data has been collected and entered in a spreadsheet or QIDS, you need to interpret the data in a meaningful way to determine if an improvement has occurred. QIDS has the functionality for you to easily build different charts suitable for your improvement project.
Run charts are line graphs showing data over time. Run charts are an effective tool to tell the project story and communicate the project’s achievements with stakeholders. Run charts illustrate what progress has occurred, what impact the changes are having and ultimately, if improvement is happening.
Including annotations in your run chart will help to show when change ideas have been tested and may be associated with an improvement. There are specific rules to interpreting run charts which can be found via the CEC QI Academy webpages. Your local QI advisor may be able to assist with the display and analysis of data
There are a number of different charts (for example, Histogram, SPC Chart etc) which can be used to present your data. Visit the CEC QI Academy webpages for more information.
Determining if improvement has really happened and if it is lasting requires observing patterns over time. Probability-based rules are helpful to detect non-random evidence of change.
For more information on types of data, minimum data point and the probability-based rules go to the CEC QI Academy webpages. It is recommended that you contact your local quality advisor for assistance.
For example, if you are using a run chart, an improvement is considered reliable when six consecutive data points are above 95%, that is, compliance with the new process implemented occurs 95% of the time.